Introduction to Candlestick Charts
What Is a Candlestick Chart?
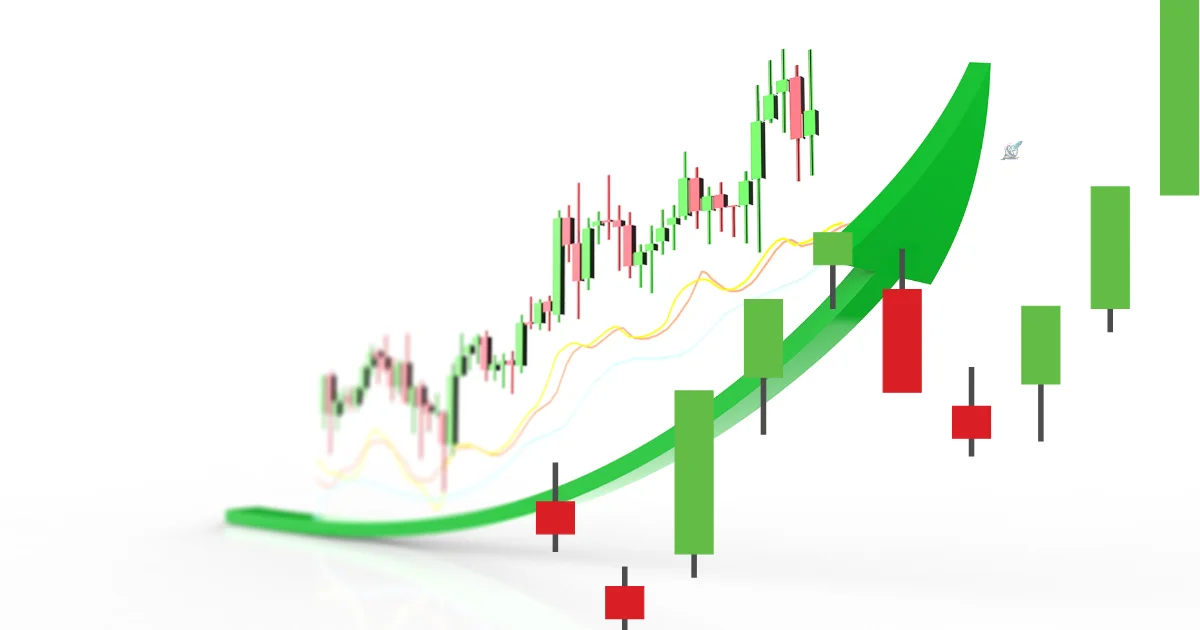
A candlestick chart is a type of financial graph used to describe price movements of securities, derivatives, or currency pairs over time. Each candlestick provides vital information about the asset’s open, close, high, and low prices within a specific time period.
Originally created in Japan in the 18th century by rice merchants, this charting method became well-known in the West after Steve Nison included it in his book Japanese
Candlestick Charting Techniques
Candle Graphs: Historical Background and Origin
The technique goes back to Munehisa Homma, a Japanese rice trader who understood that market psychology affected rice prices just as much as supply and demand. Modern candlestick research was founded on his system.
Single Candle Anatomy Candle Body and Shadows
Every candlestick is made up of two key components:
Represents the range between the opening and closing prices.
Show the session’s highest and lowest prices, Shadows (Wicks).
Bullish vs. Bearish Candles
Bullish Candle: Usually green or white, close is higher than open.
Bearish Candle: Close is lower than open; usually crimson or black.
Understanding Timeframes in Candlestick Charts
Add Your Heading Text Here
1-minute: Scalping transactions
Day trading: 5 to 15 minutes
Swing trading: 1 hour to 4 hours
Long-term study: Daily or Weekly
Choosing the Right Timeframe
Your trading approach will determine the ideal time frame:
Lower timeframes help scalpers.
Swing traders usually study 1H or 4H charts.
Investors examine weekly or daily charts.
Important Candlestick Parts
Price at the start of the time frame
End-of-time-frame price
High : Maximum price attained
Low : Minimum price touched
Body: Difference between open and close High or low outside the body
Single Candlestick Patterns
Doji, Hammer, Shooting Star
Doji: Open and close are almost the same, indicating uncertainty.
Hammer: Small body with long lower wick — bullish reversal.
Shooting Star: Small body with long upper wick — bearish reversal.
Marubozu, Spinning Top
Spinning Top: Small body, long wicks — market uncertainty.
Marubozu: Strong trend indication with full body and no wicks.
Double Candlestick Patterns Engulfing Patterns
Bullish Engulfing / Bearish Engulfing
Bullish Engulfing: Small red followed by huge green—bullish reversal.
Bearish Engulfing: Large red follows small green—bearish reversal.
Tweezer Bottoms and Tops
Tweezer Top: Two candles with equal highs — bearish signal.
Tweezer Bottom: Two candles with equal lows — bullish signal.
Three Candlestick Patterns
Three Candlestick Patterns
Morning Star, Evening Star
Morning Star: Bearish, indecision, then bullish candle — bullish reversal.
Evening Star: Bullish, indecision, then bearish — bearish reversal.
Three White Soldiers and Three candles Black Crows
Three White Soldiers: Three consecutive bullish candles — trend confirmation.
Three Black Crows: Three bearish — strong downtrend.

Business Consultant | Web designer & Developer | Social media Manager | SEO | Passionate Learner, I am deeply passionate about learning and continuously improving my skills.
My interests are diverse, ranging from music and singing to computers and programming languages, digital art, AI